Windows8ストアアプリ Chart グラフ(VB)
Chart グラフ(VB)
血圧帳なので、グラフは必須だ。探してみると、Windows 8 Toolkit - Charts and More(MS)http://modernuitoolkit.codeplex.com/に転がっていた。
まだ、Beta版だが、自作するよりは簡単だ。
ただ、やはりまだ、VB、C#はコントロールが充実していないように思う。
javascript+HTMLで作ったほうが、思い描くことが簡単にできる環境、例えばJQuery等が使えるのでできるように思います。
でも、気を取り直して、
サイトからWindows 8 Toolkit - Charts and More(MS)をダウンロード視します。
適当なフォルダに解凍し、
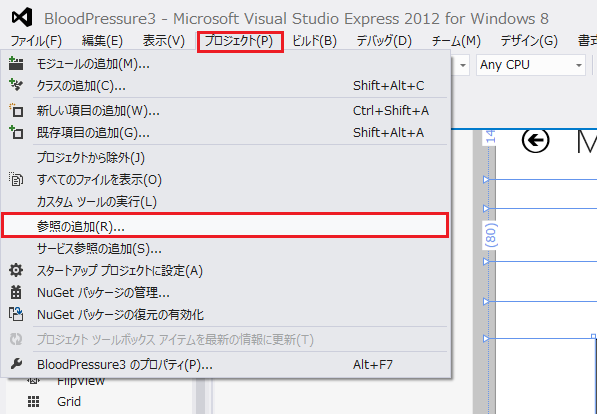
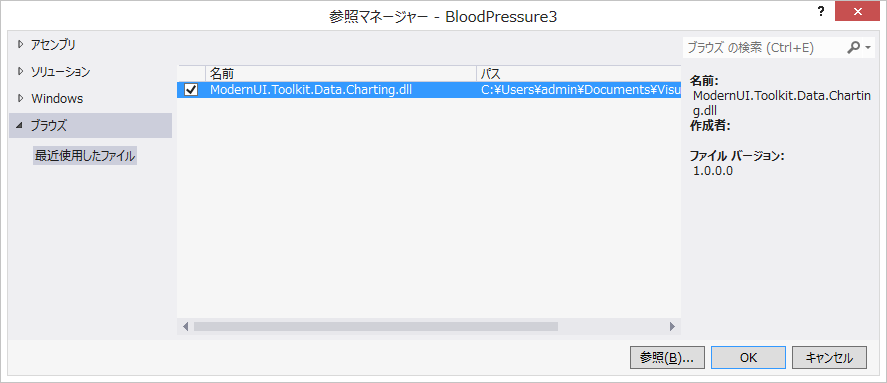
プロジェクト-参照の追加から、追加します。
次に、XAMLに書き加えます。
<common:LayoutAwarePage
    xmlns="http://schemas.microsoft.com/winfx/2006/xaml/presentation"
    xmlns:x="http://schemas.microsoft.com/winfx/2006/xaml"
    xmlns:local="using:BloodPressure3"
    xmlns:common="using:BloodPressure3.Common"
    xmlns:d="http://schemas.microsoft.com/expression/blend/2008"
    xmlns:mc="http://schemas.openxmlformats.org/markup-compatibility/2006"
	この部分を追加
    xmlns:Series="using:ModernUI.Toolkit.Data.Charting.Charts.Series"
    xmlns:Axis="using:ModernUI.Toolkit.Data.Charting.Charts.Axis"
    xmlns:Charting="using:ModernUI.Toolkit.Data.Charting"
    xmlns:DataPoints="using:ModernUI.Toolkit.Data.Charting.Charts.DataPoints"
    xmlns:Chart="using:ModernUI.Toolkit.Data.Charting.Charts.Chart"
    xmlns:Legends="using:ModernUI.Toolkit.Data.Charting.Legends"
    xmlns:System="using:System"

	省略

	<Chart:Chart x:Name="LineChart" Grid.Row="5" Title="血圧グラフ" HorizontalAlignment="Stretch"  VerticalAlignment="Stretch" FontFamily="Global User Interface"  Margin="150,0,50,10" >
                <Series:LineSeries
    			Title="血圧上"
    			IndependentValueBinding="{Binding DateTime}"
    			DependentValueBinding="{Binding Value}" IsSelectionEnabled="True" >
				任意の色をグラフで使用するには以下のようにするとできました。
                    <Series:LineSeries.DataPointStyle>
                        <Style TargetType="DataPoints:LineDataPoint">
                            <Setter Property="Background" Value="{StaticResource BrushUP}"/>
                        </Style>
                    </Series:LineSeries.DataPointStyle>
                </Series:LineSeries>

            </Chart:Chart>
XAMLの表示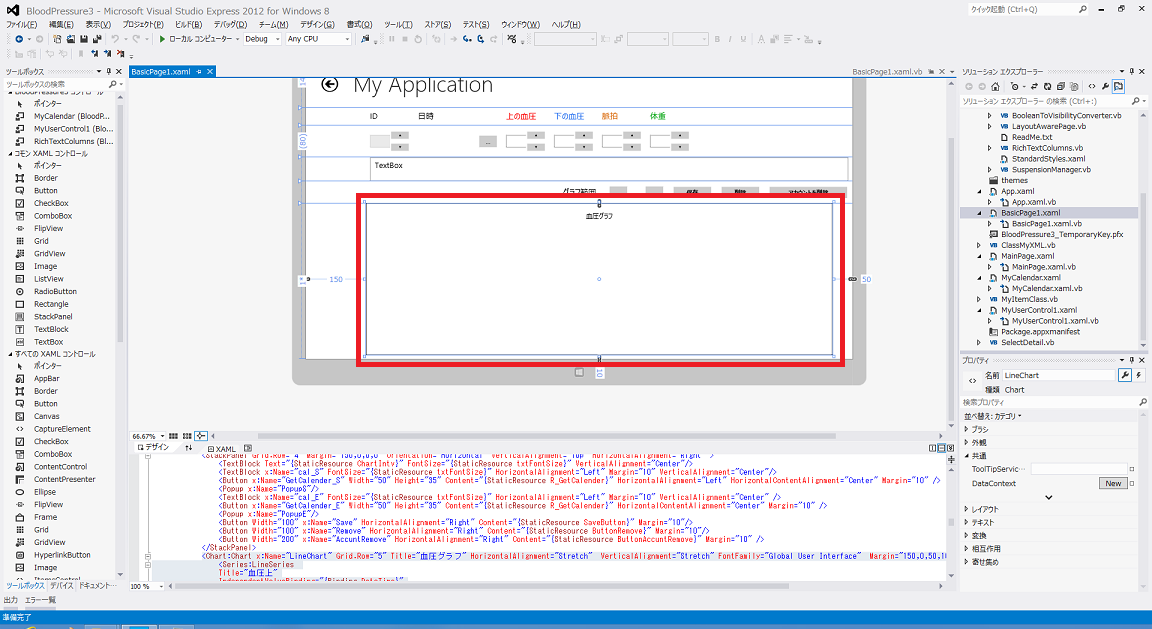
次は、VBソースに
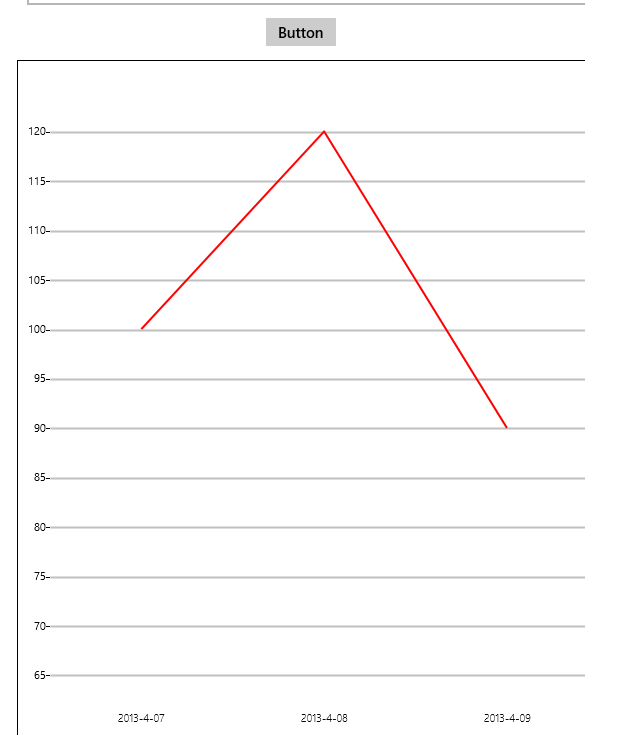
'Chart Imports ModernUI.Toolkit.Data.Charting.Charts.Axis Imports ModernUI.Toolkit.Data.Charting.Charts.Series Imports ModernUI.Toolkit.Data.Charting.Legends #Region "グラフSample" Private Sub Button_Click_1(sender As Object, e As RoutedEventArgs) MakeGraphSample() End Sub Private Sub MakeGraphSample() Dim AccuntList As New List(Of GraphXY2) Dim A As New GraphXY2 A.DateTime = "2013-4-07" A.Value = 100 AccuntList.Add(A) Dim B As New GraphXY2 B.DateTime = "2013-4-08" B.Value = 120 AccuntList.Add(B) Dim C As New GraphXY2 C.DateTime = "2013-4-09" C.Value = 90 AccuntList.Add(C) DirectCast(Me.LineChart.Series(0), LineSeries).ItemsSource = AccuntList DirectCast(Me.LineChart.Series(0), LineSeries).Refresh() End Sub Public Class GraphXY2 Public Property DateTime As String Public Property Value As Integer End Class #End Region |
と書いて実行。
実際は
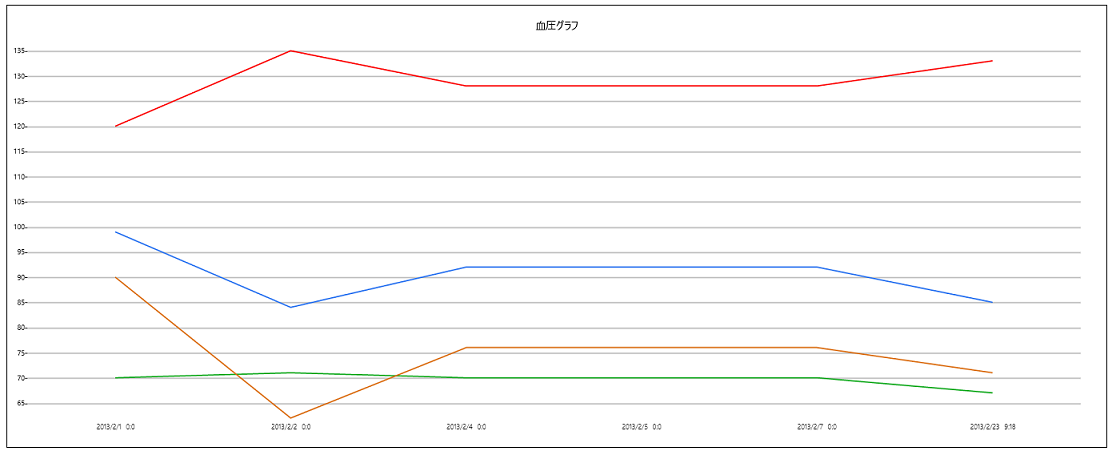
なふうに使用しています。
因みに、Windows 8 Toolkit - Charts and More(MS)の中に簡単なサンプルが入っているので大いに参考にしてください。
ただ、凡例の表示の仕方が分かりませんでした。